Mapping Carbon Pricing Around the World
Putting a price on carbon pollution is recognized as an effective, transparent and efficient policy approach to reducing Greenhouse Gas (GHG) emissions. Indeed, pricing carbon emissions is much more beneficial than paying its developmental, economic, and health costs! The good news is: more and more countries are taking advantage of this economic instrument and the number of carbon pricing initiatives (such as Carbon Tax or Emission Trading Scheme - ETS) has tripled in the last decade.
To monitor these developments, the World Bank publishes the State and Trends of Carbon Pricing report every year. Since its launch more than a decade ago, this annual report has established itself as the most important reference document—first on carbon markets and, later more broadly, on carbon pricing—by providing readers with up-to-date information on the latest developments.
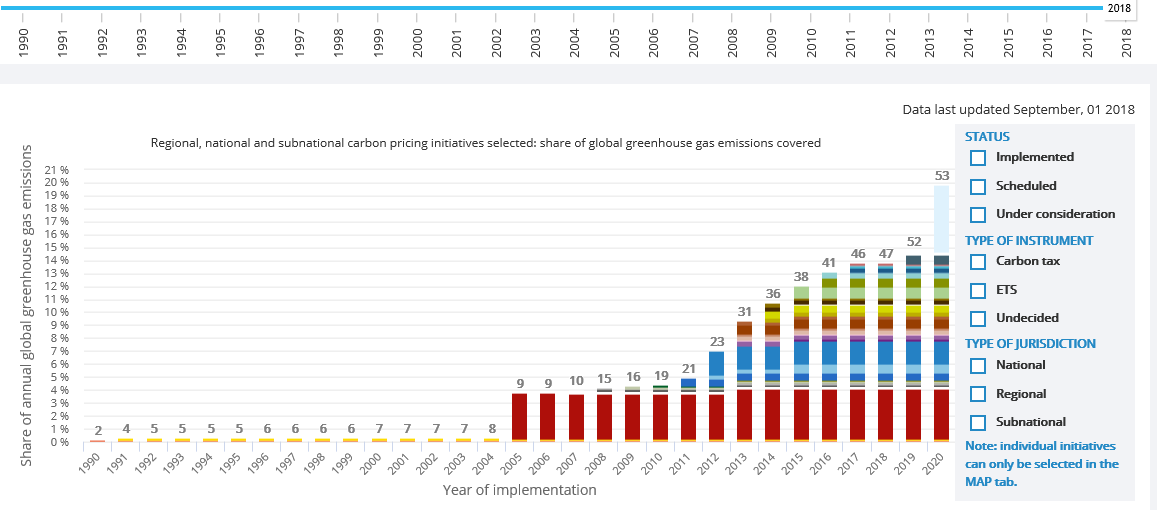
Complimenting the publication and aligned with our access to information goal, the World Bank launched the Carbon Pricing Dashboard—a one-stop-shop, online portal showcasing the data behind the report through an interactive interface. It showcases key statistics on carbon pricing initiatives worldwide and lets the users engage and extract data based on their interest. Did you know, as of September 2018, carbon pricing initiatives implemented and scheduled for implementation would cover 11 gigatons of carbon dioxide equivalent (approx. 20 percent of the global GHG emissions) compared to 8 gigatons of carbon dioxide equivalent (approx. 15 percent of the global GHG emissions) in 2017?
“We developed this dashboard to respond to a strong demand from many partners to provide regular information on carbon pricing initiatives around the world. We had a lot of data on this, which we featured in the State and Trends of Carbon Pricing report, our flagship publication on carbon pricing, but we only publish it annually” explained Celine Ramstein, Climate Change Specialist at the World Bank, and the lead coordinator of this project. She added, “We thought that the dashboard would be a good way to provide up-to-date and easily accessible data on carbon pricing. At a time when we are observing major development in carbon pricing policies around the world, we hope that this dashboard can serve as a useful resource to support the development of these policies and to advance climate action around the world.”
The Dashboard is built to cater the needs of audiences ranging from policy makers, in fiscal policy or climate change departments, as well as policy analysts, in both the public and private sectors, to researchers and enthusiastic learners. Thus, if you are new to the topic and wish to take a deep dive into carbon pricing, we suggest you start with a quick read on ‘What is Carbon Pricing?’ and watch the video to cover the basics. The ‘Resources’ section provides a wide range of reports on carbon pricing and carbon markets from the World Bank Group and partner institutions.
But, the main feature of the dashboard is its interactive Map and Data section. On one hand, the tool enables you to find data on national, regional and sub-national carbon pricing instruments, where by using the filters, you can make your own information selection, or navigate through different tabs to view the value of the selected initiatives and the emissions covered. On the other hand, the tool acts as a time machine, showcasing the progression of carbon pricing from the late 90’s. Hence, be it downloading the analytics of the selected jurisdiction or observing the trends of carbon pricing over decades, the map and data tool enables users to incorporate an enhanced analytical and a comparative approach.
As of September 1, 2018, 71 jurisdictions globally have implemented (or scheduled to implement) carbon pricing as a way to meet their climate goals. With carbon pricing policies continuing to gain traction worldwide, we hope that the Dashboard will serve as a useful resource. We encourage you to use the tool and, do let us know your comments/suggestions by writing to us at carbonpricingdashboard@worldbank.org.
The Carbon Pricing Dashboard is a product of the World Bank, with support from Ecofys, a Navigant Company, as well as from the Carbon Pricing Leadership Coalition and the International Climate Action Partnership and the Partnership for Market Readiness.
About the Author
Chandni Dinakaran works as the Knowledge Management Coordinator at the World Bank’s Carbon Markets and Innovation. Chandni, holds a Master’s degree in Political Science and Mass Communication. With six years of experience in online learning management at the World Bank, she leads the development and Monitoring & Evaluation of knowledge products such as e-Courses, Bite Sized Learning and the Massive Open Online Course (MOOC). Believing that knowledge is power, she is enthusiastic about her work that assists in enhancing client’s capacity building by translating the knowledge around climate change mitigation into accessible learning programs.


